This article is a brief outline of what I have developed and a result of request for more information. I hope it is at the right level of detail. If you want to know more please do not hesitate to get in contact and we can discuss it further.
Background
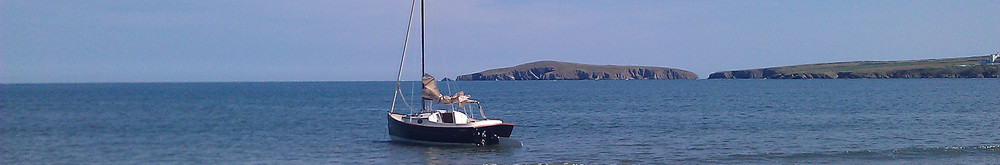
Boating for me has been day sailing and lately interspersed with 2-3 day cruising. The level of instrumentation in the boats reflected this activity. However now I have stopped work I am looking to move more towards week long cruises hence the desire to extend my usage of boat instruments.
Initially I used:
- NASA Echo Sounder (pre-NMEA0183)
- Early Garmin GPS (no map) – handheld
- Paper Charts
I then extended that setup to include:
- Anemometer from Openwind.de
- Raspberry pi outputting, COG, SOG (utilising a GPS HAT) and wind data to an Amazon Kindle device
- Android phone running Navionics ( also showed COG, SOG from phone’s GPS) primarily to track progress
My boat at the time was a Hunter Liberty 22 (Rubato). It had a 12v battery and a small generator from the outboard motor which was hardly on. So the current usage needed to be small and the battery last the season apart from overnight charges. This setup fitted that requirement.
I then changed boats and got the larger Baycruiser 26 (Bagpuss) from Swallow Yachts which came with (NMEA0183 devices):
- GlobalSat GPS
- NASA Wind (Wireless)
- NASA Compass
- Airmar Depth
- Standard Horizon VHF
- Raspberry pi running Node Red producing a web server primarily for display on a smart phone.
The Next Step
More of an extension to the system used on Rubato. I would remove the GPS HAT from the raspberry pi but extend the Kindle to display Depth and send data to Navionics to display AIS.
In the future I would like to move to Android E-ink colour devices (E-ink is low powered and not affected by the Sun) for both instrumentation display as well as a chart plotter. This could also enable the usage of a smart watch solution.
Chart-Plotters
In my limited experience the main reasons for a chart-plotter are:
- To plan a route ( probably better done on a laptop/tablet)
- Track progress
- Control an autopilot from a pre-defined route
- display extra data such as AIS
The commercial chart-plotters are moving in this direction but they also provide graphs, more helpful areas such as getting round a headland. They are better suited to NMEA2000 networks but can use WiFi as well however I do not wish to get into the expensive world of commercial chart-plotters and the incessant new features requiring you to continually upgrade.
I have not come to a conclusion what I will use but temporarily (as I have the equipment):
- Galaxy Phone (S20) in the cockpit using Navionics (seems the best for the Solent area)
- Opencpn on a Raspad 3 (runs from 12v supply) with software from Bare Boat Necessities (https://bareboat-necessities.wixsite.com/my-bareboat) for route planning. It has tides and weather and polar charts and more.
Opencpn can control an autopilot but for the moment I will track a route manually. I do have a remote control for the autopilot (seymonautica.com) which allows me the freedom to move around the boat and still adjust the autopilot. Much more useful than you would think especially when solo-sailing – such as when bringing in/laying out the mooring ropes and fenders. Note qtVLM is also very good.
My Setup
The instrument system is based around a raspberry pi model 3B. It:
- uses TinyCore LINUX that runs in memory and as such resilient to power loss
- produces a UDP/IP for COG, SOG, HDG, AWA, AWS, AWD, TWA, TWS, TWD, AIS and Depth which can be used by any device with the ability to handle WiFi based NMEA0183 messages
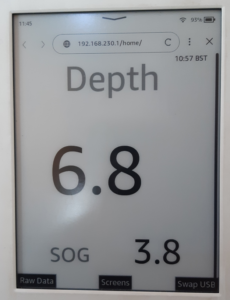
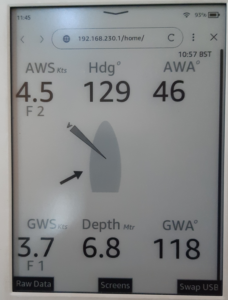
- provides a web-server tailored to an Amazon Kindle which can be read from the back of the cockpit in sunlight. I have included Beaufort levels as I seem to relate to them more.
You will note the lack of STW so the data labels have been changed to Ground rather than True.
Here are the screens:
1. Leaving and arriving
2. Normal Sailing
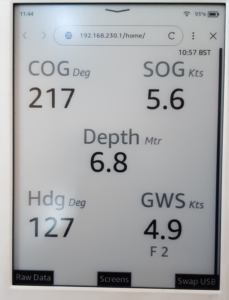
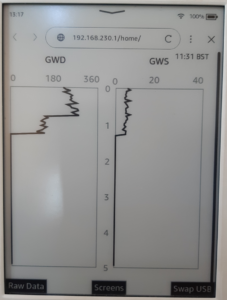
3. Data and a graph
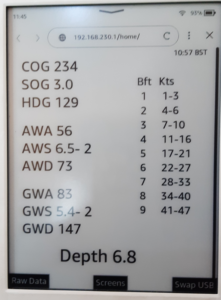
Note: the button Swap USB is no longer used as I use udev rules to determine the USB to TTY relationship and depth on each screen – I am paranoid about running aground.
Technical Description
I have divided this system into several layers – hardware, operating system and finally the software programs. The details below are pointers only, not the actual code. If you do want to build one please do get in touch – happy to provide advice and examples and maybe my image.
Hardware
The sensors being NMEA0183 devices cannot be networked together and have been designed as point to point sensors (one sensor to one display). However all the sensors need to be combined together and fed to the raspberry pi. The existing solution is to use a multiplexor which can accept many NMEA0183 inputs , combine them into one output which then feeds the raspberry pi.
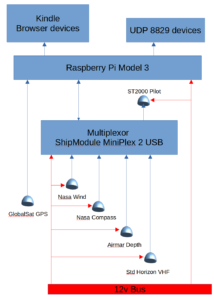
Each sensor is wired to the multiplexor which then sends the combined sentences to a USB port on the raspberry pi. The GPS system does not go through the multiplexor but goes to another USB port. The multiplexor ensures electrical isolation.
The Multiplexor is connected to the raspberry pi via a ‘host’ connection. This allows the raspberry pi to send NMEA messages to the multiplexor (as well as configuration messages). These messages can then be sent to devices that receive NMEA messages such as the autopilot.
I have also added a power shim (HAT) to the raspberry pi. These single board computers are very temperamental when it comes to power so the shim takes a 12v feed and converts it to 5v rather than using an external convertor.
The raspberry pi then provides a UDP stream over WiFi to any device capable of receiving and deciphering the NMEA messages and via a separate programme a web service for browsers. The design is deliberate to ensure there is no delay in the transmission of data over the UDP port. There is nothing worse than seeing variation in the wind not being reflected in the displays.
I use a raspberry pi model 3B which has:
- WiFi and Bluetooth.
- 4 USB Ports and a 4GB SSD card.
- The operating system is Tiny Core 13.1.0 ( piCore). It runs entirely in memory. So long as you do not need to save any data between reboots it is perfect for this application.
- I use CLI only and do not use a GUI
Operating system
The advantage and disadvantage of PiCore is that it is very small with a minimum setup. You extend the operating system to suit what you require. Once you have worked out the modules you need, you load them and then save the new software onto the hard disk so they are there when you restart (filetool.sh -b).This also goes for any configuration changes and software that you add. Loading on reboot is automatic so .filetool.lst, onboot.lst need extending to include those extra files.
I have loaded modules:
- firmware-rpi-wifi, wifi – wifi infrastructure modules
- usb-serial,usbutils,libusb-compat – infrastructure to allow USB serial connectivity.
- dnsmasq,hostapd,iptables,dhcp – infrastructure for wifi hotspot; routing and ip address allocation
The infrastructure is setup for internet access via a tethered connection as it comes by default but I do not intend to use it. The target is to provide a boat only hotspot for instrument data only.
The configuration files that will need changing:
- dnsmasq.conf
- dnsmasq.leases
- hostapd.conf
- iptables.rules
- dhcpd.conf
It is best to copy ones than modify the templates so if needed I can provide these.
Security
The security of the system reflects the lack of internet access and low powered hotspot. I have used one user – tc and one user – bagpuss for the WiFi. I have left ssh and scp ports open as they are the only method of access.
Udev rules
Linux by default assigns TTY ports in chronological order as they come on-line. This is a nightmare for programming as you do not know which TTY port you are using. Therefore Udev rules have been setup to correct this. In this installation I am using:
SUBSYSTEM==”tty”, ATTRS{idVendor}==”0403″, ATTRS{idProduct}==”fd49″, SYMLINK+=”ttyUSB_M1″
SUBSYSTEM==”tty”, ATTRS{idVendor}==”067b”, ATTRS{idProduct}==”2303″, SYMLINK+=”ttyUSB_GPS1″
Startup
When the system turns on it runs startup files:
- onboot.lst – list of all the modules that need to be loaded
- bootsync.sh – setups up the wifi and setup files that cannot run in the background
- bootlocal.sh – more network and the startup script for the 2 programmes to run
- /home/tc/bagpuss/st_tcBG_Code.sh 2>&1 /home/tc/bagpuss/misc/logs – runs the 2 programmes and allows changes without changing the system startup scripts.
The st_tcBG_Code.sh script :
- applies the udev rules
- sets up the baud rates (GPS 4800 and Multiplexer 57600)
- runs the 2 programmes:
- ./USBtoUDP /dev/ttyUSB_GPS1 /dev/ttyUSB_M1 192.168.230.255 8829 L &
- ./Webserver 192.168.230.255 8829 L &
Testing
To test the system take an output of each serial input and check it has the NMEA0183 messages you expect. Run the USBtoUDP program and check the UDP port. Then run the Webserver program and see if you can see a webpage (192.168.230.1/home).
From the GPS you get through the serial port (sudo cat /dev/ttyUSB_GPS1):
$GPGGA,111426.000,5054.8139,N,00122.5874,W,1,10,0.9,1.9,M,47.6,M,,0000*42
$GPGSA,M,3,20,07,30,05,02,09,13,06,16,29,,,1.4,0.9,1.1*32
$GPRMC,111426.000,A,5054.8139,N,00122.5874,W,0.00,0.00,281121,,,A*7C
From the Multiplexor you get through the serial port (sudo cat /dev/ttyUSB_M1) in no particular order (this is a subset):
!AIVDM,1,1,,A,13P>MIPPE4wqh58M6doKoqMT00SC,0*70
$WIVWR,40.0,R,8.8,N,,,,*65
$PSMDOV,0
$WIMWV,19.0,R,7.0,N,A*1C
$HCHDG,302.6,,,,*45
$SDDPT,1.0,*78
$SDDBT,3.6,f,1.0,M,0.6,F*04
The UDP output should be a combination (intertwined) of the 2 serial ports (nc -ulv 192.168.230.255:8829)
Software
I use the programming language Golang ( normally known as Go) to create the 2 programmes. The advantages of Go are:
- It is compiled and can be cross compiled to the target hardware
- Only the executable needs to be copied across to the target hardware
- It has a good library of modules
- The web server library is particularly good and allows a small web server to be easily built.
- Inbuilt parallel processing – essential to read the UDP input, process the web server and utilise the multiple cores.
My development environment is – Model 3B; NMEA0183 data taken from a real sail; windows desktop for development using visual studio and powershell. I use a linux laptop for cross compiling and use the linux laptop to transfer to the raspberry pi, test in house then on the boat.
USBtoUDP
The program takes 2 serial inputs and outputs the results over UDP/IP. The arguments state where to get the inputs from, where to put the output. In this installation the 2 serial inputs are ttyUSB_GPS1 & ttyUSB_M1. The output 192.168.230.255:8829. Please note the address ending in 255.This is important but beyond the scope of this article.
The program then opens each serial input and UDP output and then reads a line from the GPS input and then from the Multiplexor input ( if there is one there to read). There are simple error checks to ensure the NMEA sentences looks good and then it is written directly to the UDP output. The loop is continuous and has no wait times.
It has been designed to be small efficient and simple to avoid performance delays and reduce errors.
Webserver
The Webserver reads from the UDP input and presents a webserver on port 80. It also sets the system time on the raspberry pi – from the GPS feed (there is no NTP server) and then creates the derived true wind data. The time is adjusted for GMT and BST but only for the UK.
The true wind data is calculated as follows (from openwind.de – I did contribute some software to them so feel I can use this):
VMG = SOG * cos(TWA)
TWS = sqrt(SOG * SOG + AWS * AWS – (2 * SOG * AWS * cos(AWA * 3.14/180)));
TWA = acos((AWS * cos(AWA * 3.14/180) – SOG) / TWS) * 180 / 3.14
AWD = COG + AWA
TWD = TWA + COG
The values are adjusted to reflect the boat heading when displaying graphically.
There is one web page where a division is updated every 3 seconds (via JavaScript). This stops the display having an annoying visible update. Use of 2 buttons (Data and Screens) allow the user to rotate between the different sailing screens or the data screens (which includes a graph). This is to reduce the number of screens you have to go through to get to the one you want. The graph shows a history of True wind direction and speed at 5 minute intervals for 5 hours.
The Web page templates have been designed especially for the Kindle Paperwhite. The Kindle has a rudimentary browser but it does accept SVG commands which has been a life-saver especially for the graphics. The html files still work on other browsers but could be made to look better by adjusting the spacing in the html files.
This program utilises parallel processes. One for the web services and the other to process the UDP incoming data, set system time, create the derived data and prepare the data for the web services.
A high level view of the program :
Process Inputs:
UDP traffic comprising NMEA 0183 sentences as below
Outputs required:
Apparent Wind Angle: AWA : MWV
Apparent Wind Speed: AWS : MWV
Heading: HDG: HDG (compass)
Depth: DEPTH (DPT)
Speed over ground: SOG : RMC
Course over ground: COG : RMC
UTC: UTC : RMC
Derived
True Wind Speed: TWS
True Wind Angle: TWA – angle according to heading
Apparent Wind Direction: AWD – real angle
True Wind Direction: TWD – real angle
BST/GMT